Highlights
Bangla text analysis is often studied in two separate tracks: Sentiment Analysis (SA) and Emotion Recognition (ER). This paper proposes a single framework that performs both SA and ER using a hybrid approach. Instead of relying on one model, it first runs five machine learning algorithms (SVM, Logistic Regression, Decision Tree, Random Forest, KNN) and then combines their predictions using a weighted hybridization strategy based on each model’s accuracy.
Key Achievements (reported in the paper):
- 🧩 Unified task scope: One framework covers both SA (3-class) and ER (6-class) for Bangla text.
- 📚 Two new labeled datasets: SA dataset = 8,000 samples; ER dataset = 6,500 samples.
- ⚙️ Hybrid ML ensemble (no deep learning required): Uses TF-IDF + {SVM, LR, DT, RF, KNN} and then hybridizes outputs.
- 📈 Strong final metrics: Proposed framework reports Accuracy 96.57%, Precision 95.96%, Recall 95.85%, F1 95.90%.
- ✅ Improvements over individual ML models: Table III shows consistent gains over each baseline ML algorithm.
- 🧪 Lightweight compute: Implemented in Python on CPU (no GPU used) in the reported setup.
🏗️ Overall Workflow (Fig. 1)
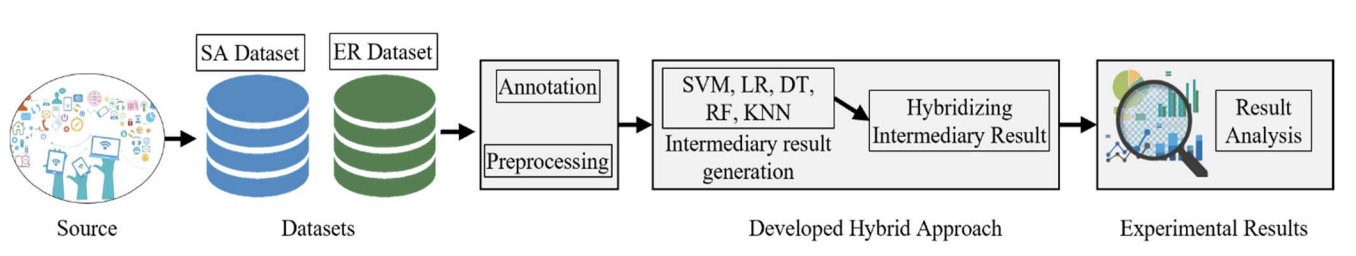
Figure 1. Workflow diagram of the proposed framework. Data are collected from online sources, then annotated and preprocessed. Next, five ML models generate intermediary predictions, which are combined by a weighted hybridization step to produce final SA/ER outputs and evaluation results.
📊 Datasets, Labels & Distribution (Tables I–II, Fig. 2)
The paper develops two separate datasets: Sentiment Analysis (SA) and Emotion Recognition (ER). Data were collected from social platforms and online sources (e.g., Facebook, YouTube, blogs, Twitter/X), and then manually annotated by the authors and linguistic experts.
Dataset sizes and class counts (reported):
• SA dataset: 8,000 samples labeled into Positive (3,500), Negative (2,500), Neutral (2,000)
• ER dataset: 6,500 samples labeled into Happy (1,300), Excited (1,200), Tender (1,200),
Sad (1,150), Scared (950), Angry (700)
Table I. Sample Dataset for SA
| Sentiment | Example |
|---|---|
| Positive | {এই রেস্টুরেন্টের পরিবেশ অনেক ভালো} |
| Negative | {তাদের ব্যবহার একদমই ভালো না} |
| Neutral | {আমি এখন খবরের কাগজ পড়ছি} |
| Positive | {এই খাবার জায়গাটার পরিবেশ দারুণ চমৎকার} |
Table I. Sample entries of the SA dataset (as shown in the paper).
Table II. Sample Dataset for ER
| Emotion | Example |
|---|---|
| Happy | {আমি ভাল আছি}, {এই খবরটা পেয়ে সে খুশি} |
| Excited | {ভালো ফলাফল করতে পেরে অনেক ভালো লাগছে} |
| Tender | {সে একজন ভালো মনের মানুষ} |
| Sad | {আজকে আমার ভালো লাগছে না} |
| Scared | {আমি বাবাকে অনেক বেশি ভয় পাই} |
| Angry | {তার সাথে কথা বলার কোনো মানেই হয় না} |
Table II. Sample entries of the ER dataset (as shown in the paper).
🧮 Class Distribution (Fig. 2)
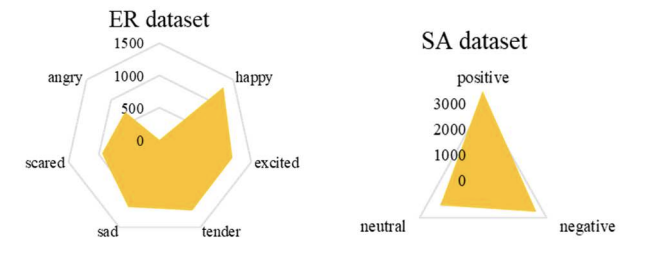
Figure 2. Distribution of data in distinct datasets. The figure summarizes how samples are distributed across SA (positive/negative/neutral) and ER (six emotion categories).
🧹 Text Preprocessing (as described)
- Unnecessary character removal: remove symbols like
*,$,@that do not help SA/ER. - Punctuation removal: punctuation is removed to reduce noise for classification.
- Stopword removal: a stopword list is prepared and applied to reduce processing time and remove non-informative tokens.
🧠 Hybrid Method: “Intermediary + Weighted Hybridization”
The method has two stages:
- Intermediary results: represent each text using TF-IDF, then train and evaluate SVM, Logistic Regression, Decision Tree, Random Forest, and KNN.
- Hybridizing results: compute each model’s accuracy, convert them into weights, then combine predicted labels by summing weights per candidate label and choosing the label with the highest total weight (Algorithm 1 in the paper).
🧪 Experimental Setup
- Split: 80% training / 20% testing (for both SA and ER)
- Feature engineering: TF-IDF vectorizer
- Hardware (reported): Intel Core i5-10500 @ 3.10GHz, 12 GB RAM, 64-bit PC
- GPU: Not used (paper states computation was not heavy)
📈 Results & Analysis (Figs. 3–4)
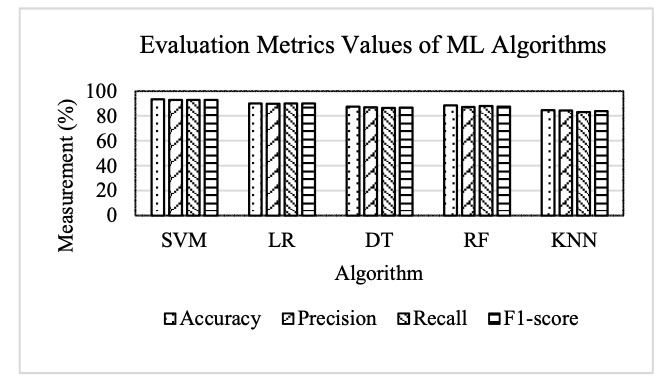
Figure 3. Evaluation metrics of ML algorithms. The paper reports that SVM provides the strongest baseline performance among the five ML models.
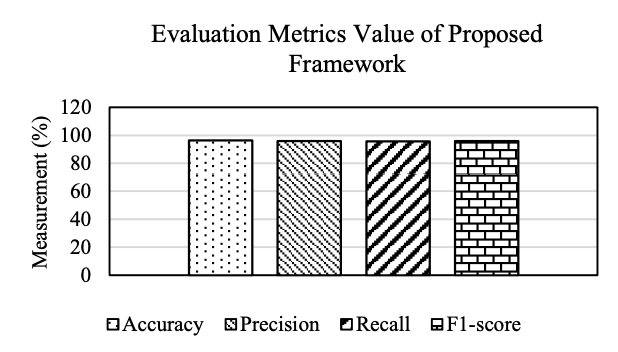
Figure 4. Evaluation metrics value of proposed framework. Reported overall performance: Accuracy 96.57%, Precision 95.96%, Recall 95.85%, F1-score 95.90%.
📊 Improvement over Individual ML Models (Table III)
Table III reports the proposed framework’s metric values and how much they improve over each individual ML baseline.
| Metric (Proposed %) | Baseline Algorithm | Baseline Value (%) | Improvement (%) |
|---|---|---|---|
| Accuracy (96.57) | SVM | 93.48 | 3.30 |
| LR | 90.25 | 7.00 | |
| DT | 87.54 | 10.31 | |
| RF | 88.68 | 8.89 | |
| KNN | 84.68 | 14.04 | |
| Precision (95.96) | SVM | 92.96 | 3.22 |
| LR | 90.00 | 6.62 | |
| DT | 87.12 | 10.14 | |
| RF | 87.21 | 10.03 | |
| KNN | 84.58 | 13.45 | |
| Recall (95.85) | SVM | 92.85 | 3.23 |
| LR | 90.13 | 6.34 | |
| DT | 86.48 | 10.83 | |
| RF | 88.14 | 8.74 | |
| KNN | 83.17 | 15.24 | |
| F1-score (95.90) | SVM | 92.90 | 3.22 |
| LR | 90.06 | 6.48 | |
| DT | 86.79 | 10.49 | |
| RF | 87.67 | 9.38 | |
| KNN | 83.86 | 14.35 |
Table III. Improvement in results while using the proposed framework (values copied from the paper).
🏁 Comparison with Existing Works (Fig. 5, Table IV)
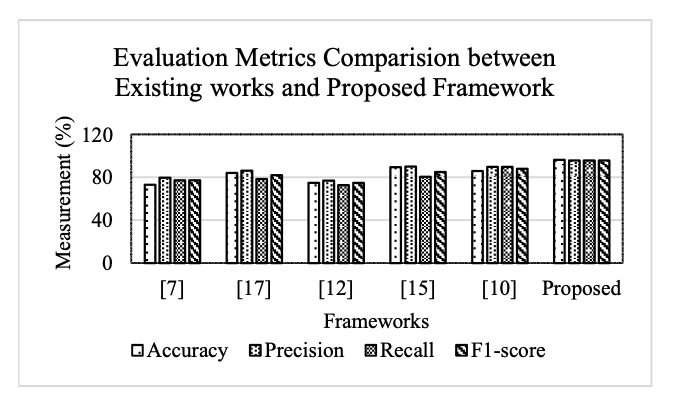
Figure 5. Evaluation metrics comparison between existing works and proposed framework. The paper reports higher overall metric values for the proposed unified SA+ER hybrid framework compared with the selected prior works.
Table IV in the paper compares multiple aspects (task scope, dataset type, feature engineering, data imbalance handling, etc.). Below is a clean HTML version of the same comparison (keeping the same aspect list and the “Proposed” column content).
| Aspect | What the paper claims for the Proposed framework |
|---|---|
| Both SA and ER | Yes (unified) |
| Hybrid approach | Yes (weighted hybridization of multiple ML outputs) |
| Datasets | Developed (new SA and ER datasets) |
| Performance | High (reported metrics ~96% range) |
| Efficiency | High (CPU-only setup; lightweight ML pipeline) |
| Domain | Multiple (data collected from multiple online sources) |
| Handling data imbalance | Yes (paper notes ensuring balanced training distribution) |
| Feature engineering | TF-IDF + Hybridizing |
| Granularity | 9 total classes (3 sentiment + 6 emotion) |
Table IV (cleaned view). Summary of the “Proposed” column from the paper’s comparison table (Table IV).
🚀 Key Contributions & Practical Impact
Technical Contributions
- Unified Bangla text analysis: simultaneously supports SA and ER in one pipeline.
- Hybrid decision rule: uses accuracy-derived weights to combine model predictions per sample.
- Reproducible ML baseline stack: TF-IDF + 5 classic ML classifiers.
Deployment / Future Directions (as stated)
- Data expansion: increase dataset size to improve generalizability.
- Advanced models: explore transformer-based deep learning for harder linguistic patterns.
- Applications: real-time systems for social media monitoring and sentiment-driven decision-making.
🔬 Research Significance
The core value of this paper is practical: it shows that a lightweight, CPU-friendly hybridization strategy can unify sentiment and emotion understanding for Bangla text and achieve strong reported metrics without relying on large neural models. This can be especially useful when compute is limited but consistent SA+ER outputs are needed.
📝 Citation
If you find Sentimen Analysis paper useful in your research, please consider citing:
@inproceedings{manik2025unifying,
  title={Unifying Sentiment Analysis and Emotion Recognition for Bangla Text: A Hybrid Approach},
  author={Manik, Md Motaleb Hossen and Sagor, Anite Halim and Mondal, Fahim Ahmed and Touhid, Md Mossadek and Islam, Md Zabirul},
  booktitle={2025 International Conference on Electrical, Computer and Communication Engineering (ECCE)},
  pages={1--6},
  year={2025},
  organization={IEEE}
}A Hybrid Framework for Sentiment Analysis from Bangla Texts
Highlights
This paper proposes a hybrid framework for performing Sentiment Analysis (SA) on Bangla and phonetic Bangla texts. Instead of relying solely on machine learning or solely on rule-based logic, the framework combines four machine learning algorithms with a newly designed rule-based approach, and merges their outputs using a weighted aggregation strategy.
Key Achievements (as reported in the paper):
- 📚 New manually built dataset: 1,600 reviews (400 Excellent, 400 Good, 400 Neutral, 400 Bad), including Bangla and phonetic Bangla.
- 🧠 Hybrid design: SVM, Logistic Regression, Decision Tree, Random Forest + 53-rule linguistic system.
- 🔍 Quantification of Polarity: Supports five sentiment levels (Strongly Positive, Positive, Neutral, Negative, Strongly Negative).
- ↩ Negation handling: Polarity inversion mechanism included (e.g., “না”, “নয়”).
- 📈 Final accuracy: 95.54%, outperforming prior Bangla SA works.
- ⚙️ Lightweight setup: Implemented in Python 3.8.8 on CPU (Intel i5, 12GB RAM), no GPU used.
🏗️ Overall Hybrid Framework (Fig. 1)
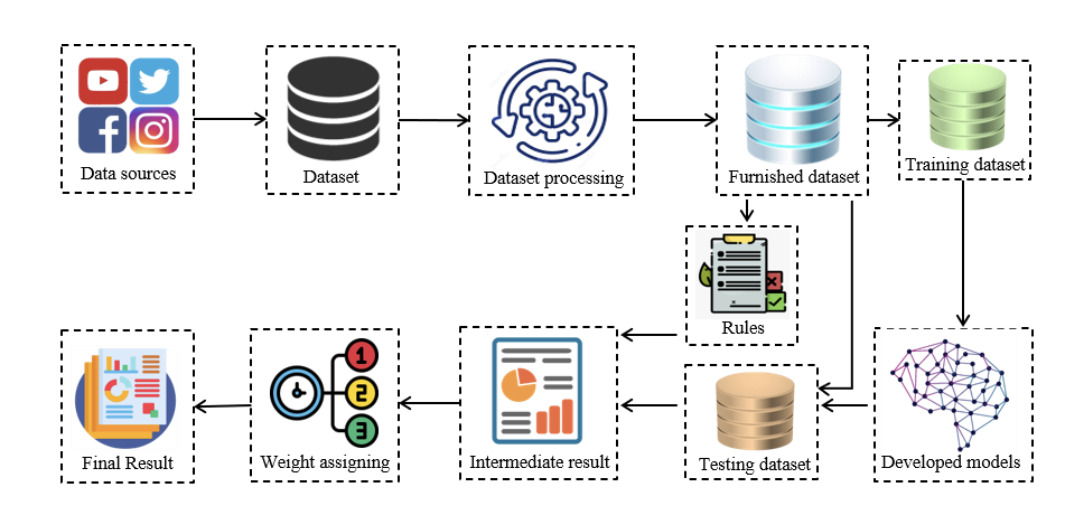
Figure 1 (page 3). The workflow begins with data collection from social platforms, followed by preprocessing and feature engineering. The dataset is split into training/validation/testing sets. In parallel, tokenization feeds a rule-based engine. Finally, outputs from ML models and rule-based approach are combined through weighted aggregation to produce the final sentiment.
📊 Dataset Construction (Section III)
Due to limited Bangla sentiment datasets, the authors manually constructed a new dataset. Reviews were collected from YouTube, Facebook, Instagram, Twitter, and manually annotated into four categories: Excellent, Good, Neutral, Bad.
The dataset contains:
- Total: 1,600 reviews
- 400 Excellent
- 400 Good
- 400 Neutral
- 400 Bad
Table II. Sample Dataset
| Actual Review | Original Form | Class |
|---|---|---|
| তাদের ব্যবহার অনেক ভালো | তাদের ব্যবহার অদেক ভাদ া | Excellent |
| Tmr kotha ar kaj a mil nai | তোমার কথা আর কাজে মিল নাই | Bad |
Table II (page 2). Sample Bangla and phonetic Bangla reviews.
🧠 Methodology
1️⃣ Machine Learning Component
- Feature selection: Unigram + Bigram
- Vectorization: TF-IDF
- Algorithms: SVM, Logistic Regression, Decision Tree, Random Forest
- Data split: 80% training, 10% validation, 10% testing
2️⃣ Rule-Based Component (53 Rules)
- 27 trigram rules
- 18 bigram rules
- 8 unigram rules
- POS-based rule design
- Polarity checking via positive/negative lexicons
- Quantification of polarity (strongly positive/negative)
- Polarity inversion handling (e.g., “না”)
📈 Accuracy Comparison (Fig. 2)
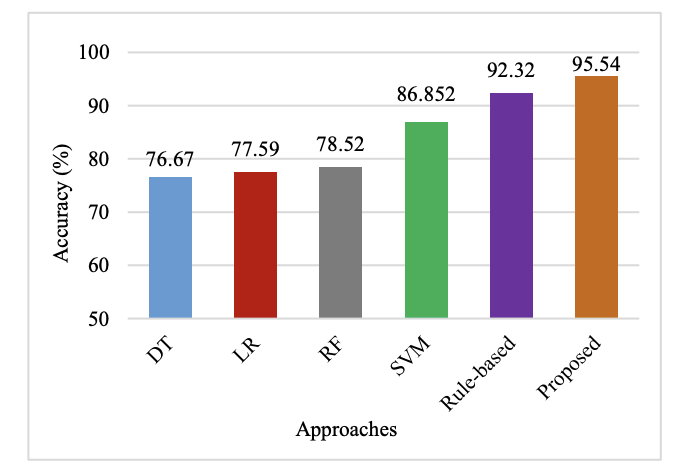
Figure 2 (page 5). SVM achieves 86.85%, rule-based approach achieves 92.32%, and the final hybrid framework achieves 95.54%.
🔎 Rule Category Impact (Fig. 3)
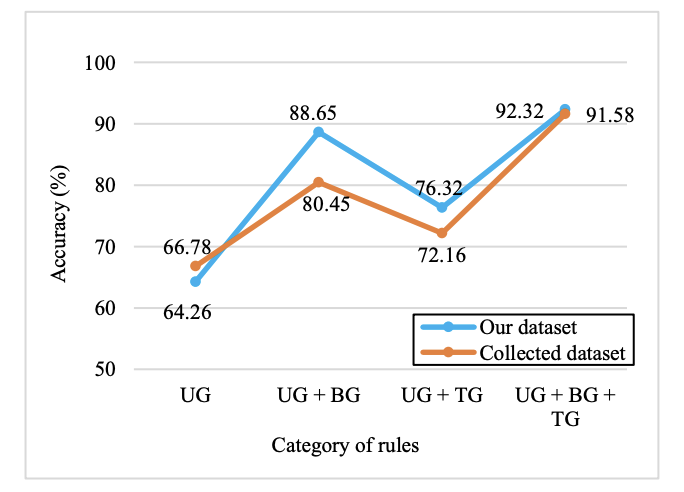
Figure 3 (page 5). Accuracy improves as rule complexity increases: unigram < unigram+bigram < unigram+bigram+trigram.
⚖️ Weighted Aggregation Strategy
Each approach receives a weight proportional to its accuracy:
Wi = Accuracy(Ai) / Σ Accuracy(Ai)
Reported weights:
- DT: 0.186
- LR: 0.188
- RF: 0.191
- SVM: 0.211
- Rule-based: 0.224
Final prediction: On = Σ (Ci × Wi)
📊 Comparison with Prior Work (Table V)
| Aspect | Proposed |
|---|---|
| Hybrid Approach | ✔ |
| Ranked Algorithms | ✔ |
| Quantified Polarity | ✔ |
| Phonetic Bangla | ✔ |
| Negation Handling | ✔ |
| Final Accuracy | 95.54% |
Table V (page 6). Proposed framework outperforms prior Bangla SA models.
⚠️ Limitations & Future Work
- Relatively small dataset (1,600 reviews)
- TF-IDF feature extraction (no deep embeddings)
- Limited number of rules (53 total)
Future improvements include larger datasets, improved feature selection, and expanding rule coverage for broader domains.
📝 Citation
If you find this paper useful in your research, please consider citing:
@inproceedings{manik2022hybrid,
  title={A Hybrid Framework for Sentiment Analysis from Bangla Texts},
  author={Manik, Md Motaleb Hossen and Haque, Fabliha and Hashem, MMA and Habib, Md Ahsan and Islam, Md Zabirul and Ahmed, Tanim},
  booktitle={2022 25th International Conference on Computer and Information Technology (ICCIT)},
  pages={517--522},
  year={2022},
  organization={IEEE}
}Public sector corruption analysis with modified K-means algorithm using perception data
Highlights
Corruption in public-sector services can be difficult to measure early using only official reports. This paper proposes a modified, attribute-weighted K-means clustering model that uses perception (survey) data to segment public organizations by corruption level. The study applies the model to Bangladesh, evaluates it against a reference corruption report, and also presents a cloud-based web application architecture for real-time data collection and analysis.
Key Achievements (as reported in the paper):
- 🧩 Survey-driven dataset: 70 survey participants; 20 public-sector organizations; 7 attributes scored in [1–5].
- ⚖️ Attribute weighting: Weights derived from corruption-type frequency statistics (e.g., bribery, negligence) instead of treating all attributes equally.
- 🔎 Meaningful segmentation: Clusters labeled as Least, Moderately, and Highly corrupted.
- ✅ Reference-based evaluation: Compared with an official corruption report; achieved accuracy = 0.875 (87.5%).
- ☁️ Deployment concept: Cloud-based Flask web app architecture for survey intake, database storage, clustering, and visualization.
🏗️ Overall Corruption Analysis Pipeline (Fig. 1)
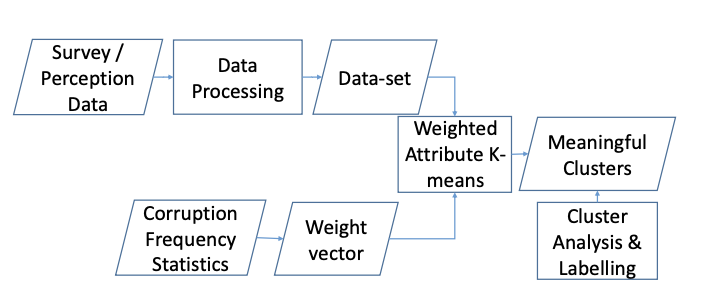
Figure 1 (page 2). The paper’s pipeline starts from survey/perception data and data processing to build a dataset of organizations. In parallel, corruption frequency statistics are used to build a weight vector. The core step is weighted-attribute K-means, producing meaningful clusters, followed by cluster analysis & labeling.
📊 Data Collection & Organization Attributes (Section III)
Each public-sector organization is represented using 7 attributes: Integrity, Accountability, Independence, Resource, Transparency, Co-operation, and Awareness. A multidimensional survey is used to score each attribute using question-level ratings of 1 (minimum), 3 (mid-point), or 5 (maximum). For each organization and attribute, the final value is the average across surveyed users.
🧾 Sample Survey Assessment (Table I)
| Field | Example (from the paper) |
|---|---|
| Organization | Passport Office |
| Attribute | Transparency |
| Question examples | Record availability, procurement info accessibility, disclosure of assets/interests, and public advertising of vacancies/openings. |
Table I (page 2). Example questionnaire block used to compute an attribute score (Transparency) for an organization.
Dataset size (as reported): data collected from 70 survey participants; dataset includes 20 public-sector organizations; each described by 7 attributes with values in [1, 5].
📌 Why Attribute Weighting Matters (Fig. 2, Table II)
Standard K-means uses Euclidean distance and effectively treats all attributes as equally important. The paper argues this is misleading for corruption analysis because some corruption types occur much more frequently (for example, bribery and negligence). Therefore, the model builds a weight vector using corruption-type frequency statistics and applies weighted distance in clustering.
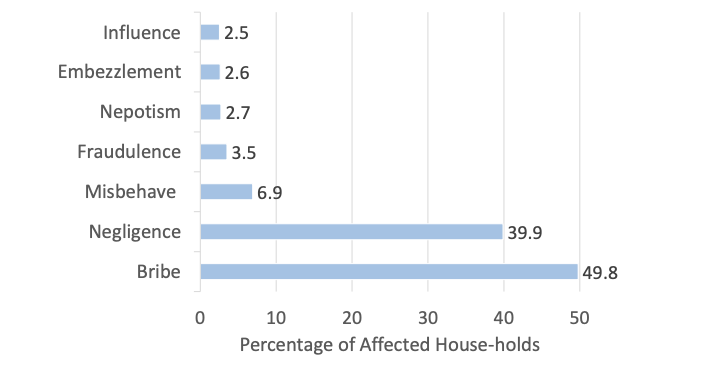
Figure 2 (page 2). The paper reports household victim percentages by corruption type, including Bribe (49.8) and Negligence (39.9) as the most frequent categories, followed by smaller-frequency types. These frequencies motivate higher weights for attributes linked to high-frequency corruption types.
⚖️ Weight Vector of Attributes (Table II)
| Attribute | Weight | Indicator of |
|---|---|---|
| Integrity | 0.46 | Bribery, unauthorized money |
| Accountability | 0.37 | Negligence of duties |
| Co-operation | 0.06 | Harassment, misbehavior |
| Transparency | 0.03 | Fraudulence |
| Awareness | 0.03 | Fraudulence |
| Resource | 0.02 | Embezzlement, fraudulence |
| Independence | 0.02 | Nepotism, influential interference |
Table II (page 2). Normalized attribute weights used by the proposed model.
🧠 Core Model: Attribute-Weighted K-means (Section IV)
The clustering uses a weighted distance (instead of standard Euclidean distance). Each attribute belongs to a weight partition, and the distance between organizations is computed by multiplying each squared attribute difference by its attribute weight.
The algorithm initializes K = 3 cluster centers using uniform attribute values from the set {1, 3, 5}, assigns organizations to the nearest weighted-distance centroid, and iteratively updates cluster centers until the stress function falls below a threshold.
📈 Results: Cluster Centers & Separation (Table III, Fig. 3)
📐 Resultant Cluster Centers (Table III)
| Attribute | Centroid 1 | Centroid 2 | Centroid 3 |
|---|---|---|---|
| Integrity | 4.13 | 3.05 | 1.68 |
| Accountability | 3.89 | 2.90 | 2.25 |
| Co-operation | 3.37 | 3.15 | 3.04 |
| Transparency | 3.33 | 3.21 | 3.14 |
| Awareness | 3.11 | 2.60 | 2.98 |
| Resource | 3.20 | 2.80 | 3.01 |
| Independence | 3.41 | 3.34 | 3.11 |
Table III (page 3). Cluster centers found by the proposed weighted K-means.
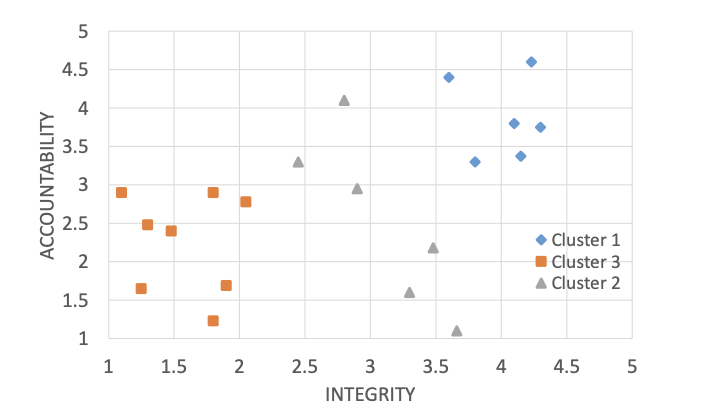
Figure 3 (page 3). Scatter plot of organizations using the two most heavily weighted attributes: Integrity and Accountability, showing cluster separation.
🏷️ Cluster Labels (Table IV)
| Cluster ID | Weighted Sum of Attributes | Classification |
|---|---|---|
| Cluster 1 | 169.24 | Least corrupted |
| Cluster 2 | 123.83 | Moderately corrupted |
| Cluster 3 | 92.50 | Highly corrupted |
Table IV (page 3). Cluster labeling derived from weighted sums of cluster-center attributes.
✅ Evaluation vs Reference Corruption Report (Tables V–VI)
To validate reliability, the paper compares the model’s cluster labels against a reference corruption report (TIB National Household Survey 2017). Performance is summarized using precision, recall, and F1-score per cluster, along with macro and weighted averages.
📊 Performance Analysis (Table V)
| Class | Precision | Recall | F1-score |
|---|---|---|---|
| Cluster 1 (Least Corrupted) | 1.000 | 0.750 | 0.857 |
| Cluster 2 (Moderately Corrupted) | 0.875 | 0.875 | 0.875 |
| Cluster 3 (Highly Corrupted) | 0.800 | 1.000 | 0.889 |
| Accuracy | 0.875 | ||
| Macro Average | 0.892 | 0.875 | 0.874 |
| Weighted Average | 0.887 | 0.875 | 0.874 |
Table V (page 4). Precision/recall/F1 by cluster, plus macro and weighted averages.
🧾 Sector-by-Sector Comparison (Table VI)
The paper lists sector corruption percentages from the reference report and compares them against the model’s predicted class. (Below is the paper’s table rendered into HTML.)
| Organizations | % Affected | Classification by % | Model Classification |
|---|---|---|---|
| Law Agency | 72.5 | High | High |
| Passport | 67.3 | High | High |
| BRTA | 65.4 | High | Moderate |
| Judiciary | 60.5 | High | High |
| Land Services | 44.9 | Moderate | Moderate |
| Education | 42.9 | Moderate | Moderate |
| Health | 42.5 | Moderate | Moderate |
| Agriculture | 41.6 | Moderate | Moderate |
| Electricity | 38.9 | Moderate | Moderate |
| Gas | 38.3 | Moderate | Moderate |
| Local Gov. Institute | 26.7 | Moderate | Moderate |
| Insurance | 12.3 | Least | Least |
| Tax and Customs | 11.1 | Least | Moderate |
| Banking | 5.7 | Least | Least |
| NGO | 5.4 | Least | Least |
Table VI (page 4). Side-by-side comparison between reference sector classification and the model’s predicted class.
☁️ Real-Time Cloud Web Application Architecture (Fig. 4)
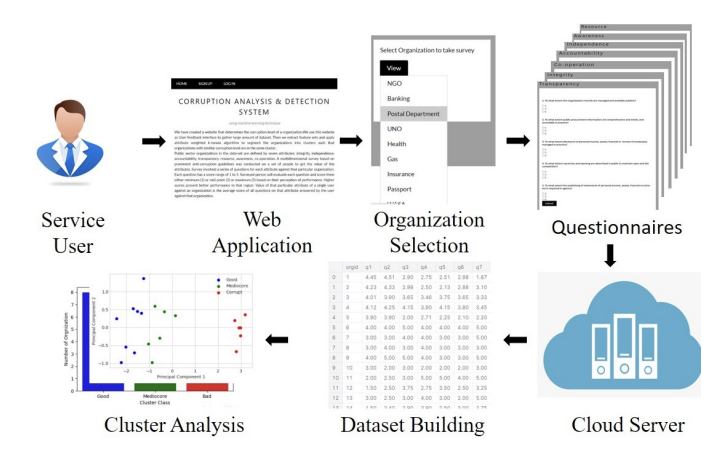
Figure 4 (page 4). The paper’s deployment design uses a Flask-based web UI where a user selects an organization, answers questionnaires, and submits scores. The backend processes scores, stores the dataset in a database, runs the proposed clustering on a cloud server, and returns results with visualizations (charts/tables/plots).
🚀 Practical Impact (as described)
- Early segmentation: Uses perception data to group sectors as least/moderate/high corruption, supporting prioritization of audits and interventions.
- Adaptable weighting: Attribute weights reflect corruption-type frequency, so the model emphasizes dominant corruption channels.
- Scalable collection: Web-based design supports larger-scale data collection and repeated re-analysis over time.
⚠️ Limitations & Future Directions (as stated)
- Collect more data across countries, more organizations, and more diverse populations to improve generalization.
- Expand survey coverage to better represent the full spectrum of public-sector experiences.
📝 Citation
If you find this paper useful in your research, please consider citing:
@inproceedings{pramanik2020public,
  title={Public sector corruption analysis with modified K-means algorithm using perception data},
  author={Pramanik, Anik and Sarker, Amlan and Islam, Zabirul and Hashem, MMA},
  booktitle={2020 11th International Conference on Electrical and Computer Engineering (ICECE)},
  pages={198--201},
  year={2020},
  organization={IEEE}
}