NeurIPS 2024 Workshop

TrialDura: Hierarchical Attention Transformer for Interpretable Clinical Trial Duration Prediction

A hierarchical transformer architecture for modeling multi-level clinical trial features, enabling accurate and interpretable prediction of trial completion timelines.

Ling Yue, Jonathan Li, Sixue Xing, Md Zabirul Islam, Bolun Xia, Tianfan Fu, Jintai Chen

NeurIPS 2024 Workshop on AI for New Drug Modalities

Why Trial Duration Prediction Matters

Interpretable, multimodal timeline forecasting for clinical trial planning and budgeting

Clinical trials are often long and expensive, so reliable duration prediction supports budgeting, staffing, recruitment planning, and operational risk management. TrialDura formulates duration prediction as a supervised regression problem and estimates trial duration (years) using multimodal trial records.

Inputs: (1) trial phase (I–IV, one-hot), (2) disease set (ICD-10 codes), (3) drug molecules (drug names), and (4) eligibility criteria (inclusion + exclusion text). TrialDura embeds drug/disease/criteria text with Bio-BERT and models criteria using hierarchical attention to obtain interpretable importance signals.

Dataset scale: 114,604 trials total, split temporally: training/validation trials starting before Jan 1, 2019 and test trials starting after. The paper reports 77,818 training records and 36,786 testing records.

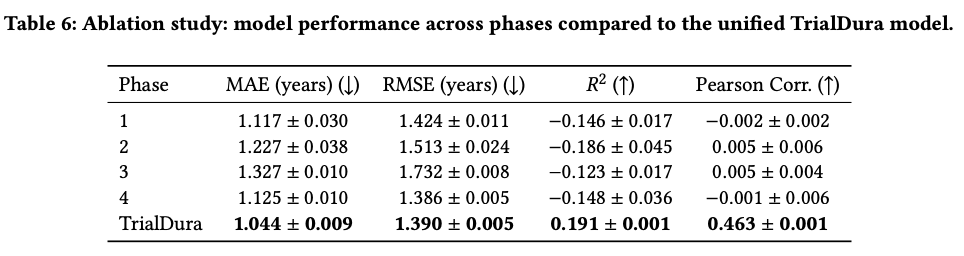
Hierarchical Attention Transformer (TrialDura)

Bio-BERT embeddings + hierarchical attention over eligibility criteria + regression head

TrialDura Architecture (Figure 1)
1 Bio-BERT Embeddings
Drug names and disease codes are embedded with Bio-BERT into 768-D vectors 
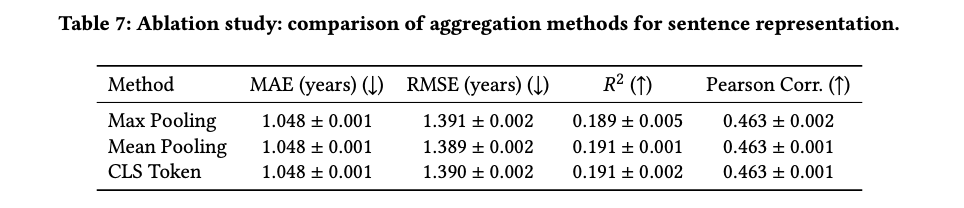
(token embeddings averaged). Eligibility criteria sentences use the Bio-BERT CLS token embedding.
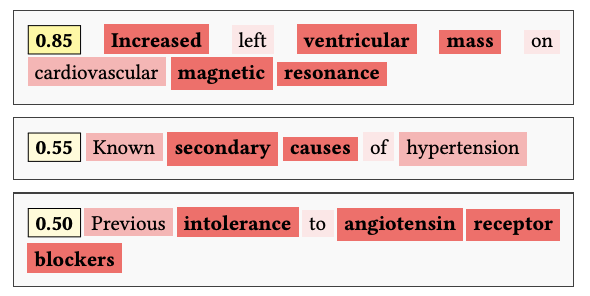
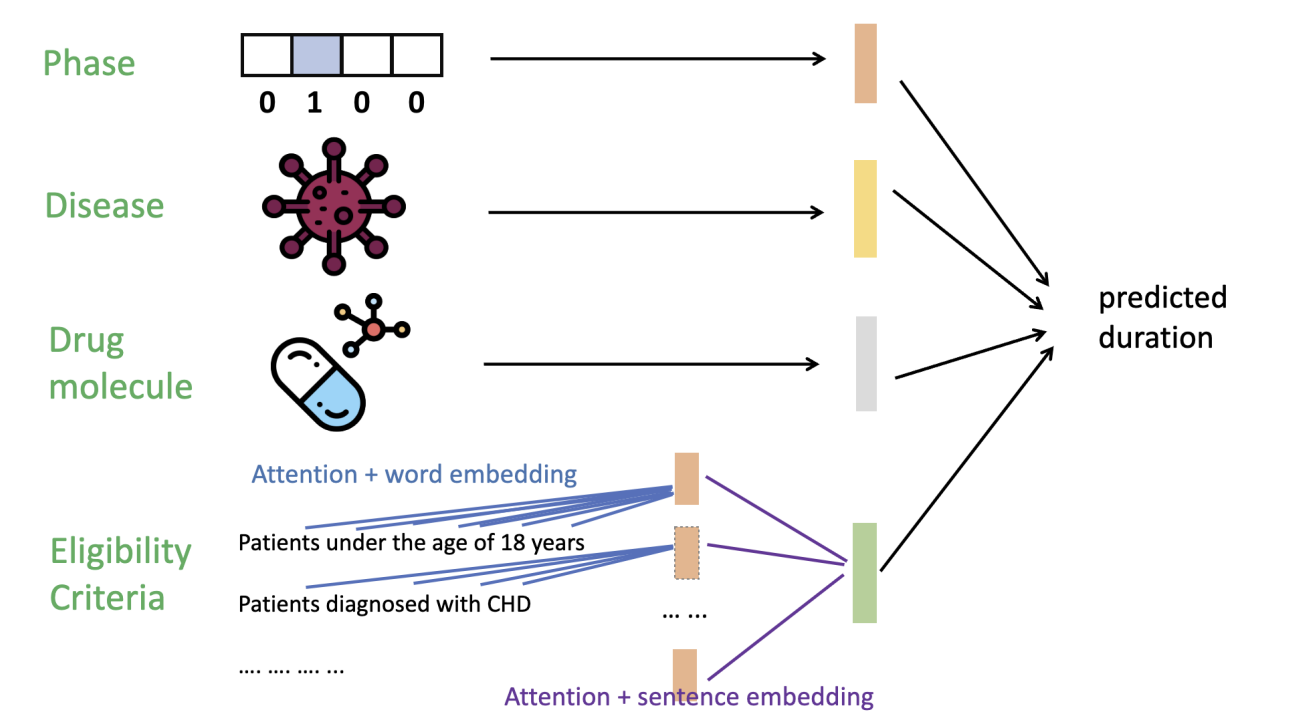
2 Hierarchical Attention for Eligibility Criteria
Word-/token-level signals build sentence embeddings; a transformer attention block captures sentence-to-sentence relationships across inclusion and exclusion criteria to form a paragraph-level representation.
3 Multimodal Concatenation
Phase (one-hot) + drug embedding + disease embedding + eligibility embedding are concatenated into a unified representation for prediction.
4 MLP Regression Head
A multi-layer perceptron predicts continuous trial duration (years), trained using Mean Squared Error (MSE).
1.044 yrs
MAE (TrialDura)
1.390 yrs
RMSE (TrialDura)
0.463
Pearson Corr.
114,604
Clinical Trials
Clinical trial record example (Table 1)
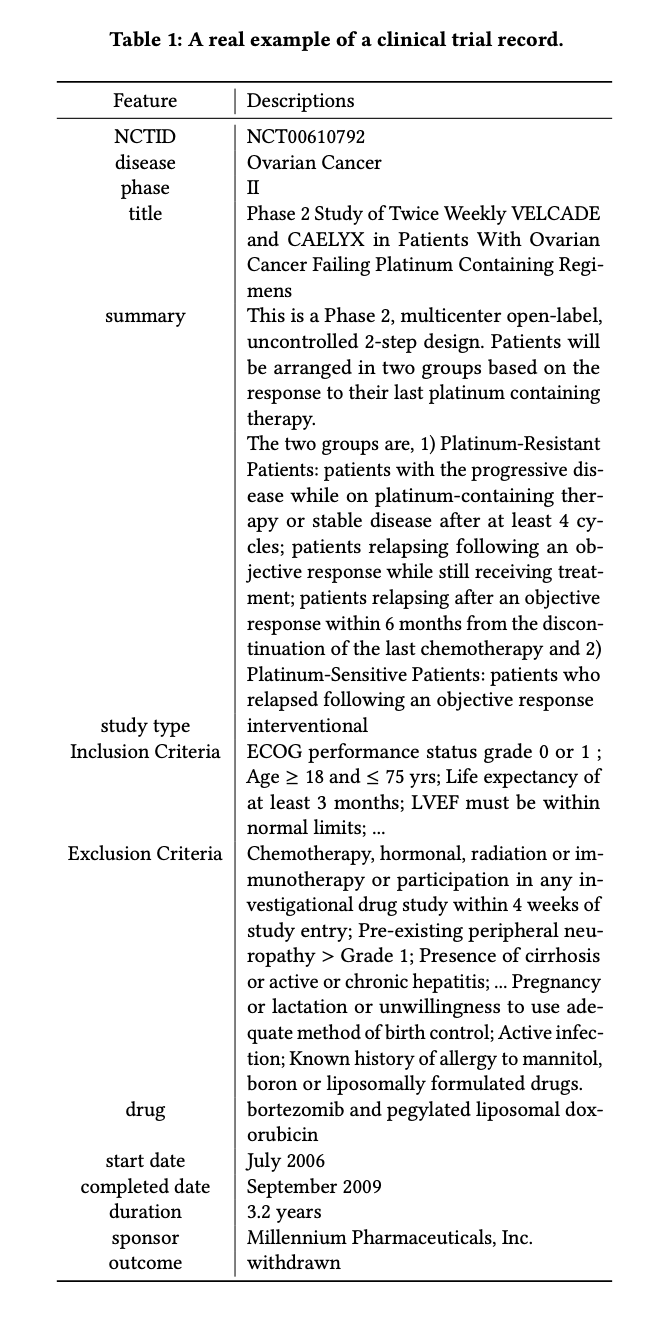
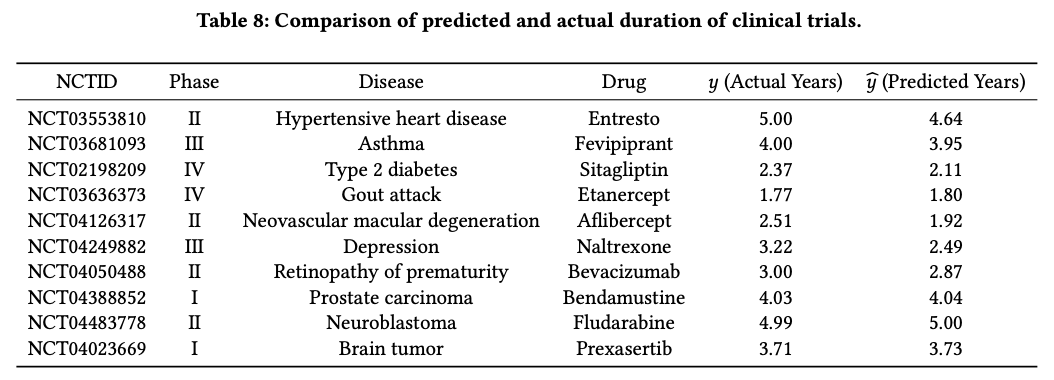
Table 1: Example Clinical Trial Record
A concrete trial instance illustrating the multimodal inputs used by TrialDura, including trial phase, disease (ICD-coded), drug molecules, and structured eligibility criteria (inclusion/exclusion). Start date, completion date, and derived duration serve as supervision for regression modeling.

Large-Scale Evaluation

Benchmarking against classical ML and neural baselines on 114,604 ClinicalTrials.gov records

Performance summary table (Table 4)
Table 4: Main Performance Comparison
TrialDura achieves the best overall results (lowest MAE and RMSE; highest R² and Pearson correlation) compared to MEAN, Linear Regression, GBDT, RF, XGBoost, AdaBoost, and MLP baselines.
Model performance comparison (Figure 2)
Figure 2: Model Performance Comparison
Visualization of MAE and RMSE across baselines. TrialDura is best (lowest error) across both metrics, matching the quantitative ranking in Table 4.
Performance across phases (Table 5)
Table 5: Performance Across Trial Phases
TrialDura performance reported for Phase 1–4 and overall, showing phase-dependent difficulty.

Explaining Predictions with Shapley Values

Identifying which eligibility criteria sentences/terms drive duration estimates

Shapley visualization (Figure 3)
Figure 3: Shapley-Based Text Attribution
Example interpretability visualization for Clinical Trial NCT03553810. Darker segments indicate higher Shapley value / stronger contribution to the predicted duration, providing transparency into which eligibility criteria constraints most influence the model.

Ablation Study

Understanding the contribution of unified training and sentence aggregation choices

Ablation across phases (Table 6)
Table 6: Phase-Specific vs Unified Model
Phase-only models show negative R² and near-zero Pearson correlation, while the unified TrialDura achieves robust positive R² and correlation, supporting cross-phase learning.
Pooling methods comparison (Table 7)
Table 7: Aggregation Methods (Max / Mean / CLS)
Max pooling, mean pooling, and CLS token aggregation yield very similar results; mean pooling is slightly better in R² by a narrow margin in the reported experiments.

Predicted vs Actual Trial Duration

Examples across phases, diseases, and drugs

Predicted vs actual durations (Table 8)
Table 8: Predicted and Actual Duration Examples
TrialDura predictions track real trial durations across diverse conditions and drugs, illustrating practical forecasting utility for planning and resource allocation.

Citation

@article{yue2024trialdura,
  title={TrialDura: Hierarchical Attention Transformer for Interpretable Clinical Trial Duration Prediction},
  author={Yue, Ling and Li, Jonathan and Islam, Md Zabirul and Xia, Bolun and Fu, Tianfan and Chen, Jintai},
  journal={arXiv preprint arXiv:2404.13235},
  year={2024}
}